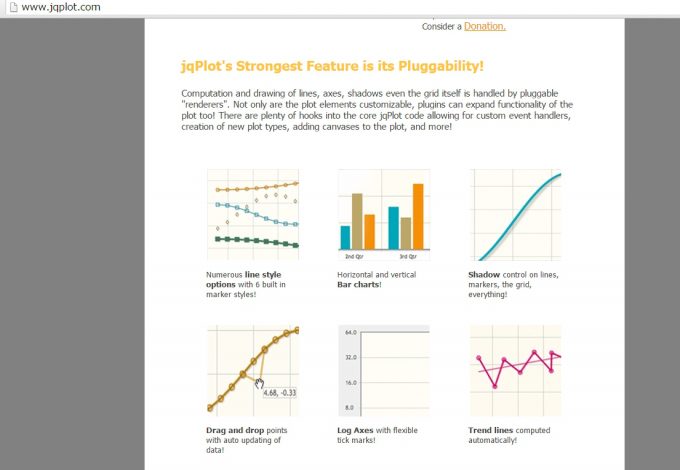
jqPlotっていうJavaScriptのライブラリがあるんですが、きれいなグラフを簡単に表示できて重宝しています。
今回、jqPlotでnullを入れるとグラフがバグって表示がおかしくなるので調査してみました。
jqPlot とは
↓jqPlotの公式サイトはこちらです。
jqPlot Charts and Graphs for jQuery
jqPlotでnull値を入れるとバグが発生する
ところで、jqPlotを使ってこんな値でグラフを作ってみました。
|
1 2 3 4 5 6 7 8 9 10 11 12 13 14 15 16 17 18 19 20 21 22 23 24 25 26 27 28 29 30 31 32 33 34 35 36 37 38 39 40 41 42 43 44 45 46 47 48 49 50 51 52 53 54 55 |
opts = { legend: { show: true, placement: 'inside', location: 'sw' }, seriesDefaults: { lineWidth: 1 }, // 軸の設定 axes: { // X軸は日付 xaxis: { renderer: $.jqplot.DateAxisRenderer, tickOptions: { formatString: "%Y/%#m/%#d", fontFamily: 'Meiryo' } }, // y軸 yaxis: { renderer: $.jqplot.CanvasAxisLabelRenderer, max: 1, min: 30 tickOptions: { mark: 'outside', formatString: '%d', fontFamily: 'Meiryo' } } }, cursor: { show:true, showVerticalLine:true, showTooltip:false }, highlighter: { show: true, showMarker: true, tooltipLocation: 's', tooltipAxes: 'xy', formatString: '%s<br><center> %s </center>' } }; plot1 = jQuery.jqplot('chart1', [[['2016/6/6', null], ['2016/6/8', 28], ['2016/6/12', 3]]] , opts); plot1.redraw(); |
すると、こんなグラフが出来ました。
どうやら、null値は、単なるnullではなくて、
'null'
と書かないとバグるようです。
以下のように書き直してみました。
|
1 2 |
plot1 = jQuery.jqplot('chart1', [[['2016/6/6', 'null'], ['2016/6/8', 28], ['2016/6/12', 3]]] , opts); plot1.redraw(); |
結果は次の通りです。
ちゃんと表示出来ました!
プログラミングの無料レッスン体験
約8,000名の受講生と80社以上の導入実績のあるプログラミングやWebデザインのオンラインマンツーマンレッスンCodecamp
<Codecampの特徴>
1 現役エンジニアによる指導
2オンラインでのマンツーマン形式の講義
3大手企業にも導入されている実践的なカリキュラム
↓無料体験レッスン実施中です。


コメント